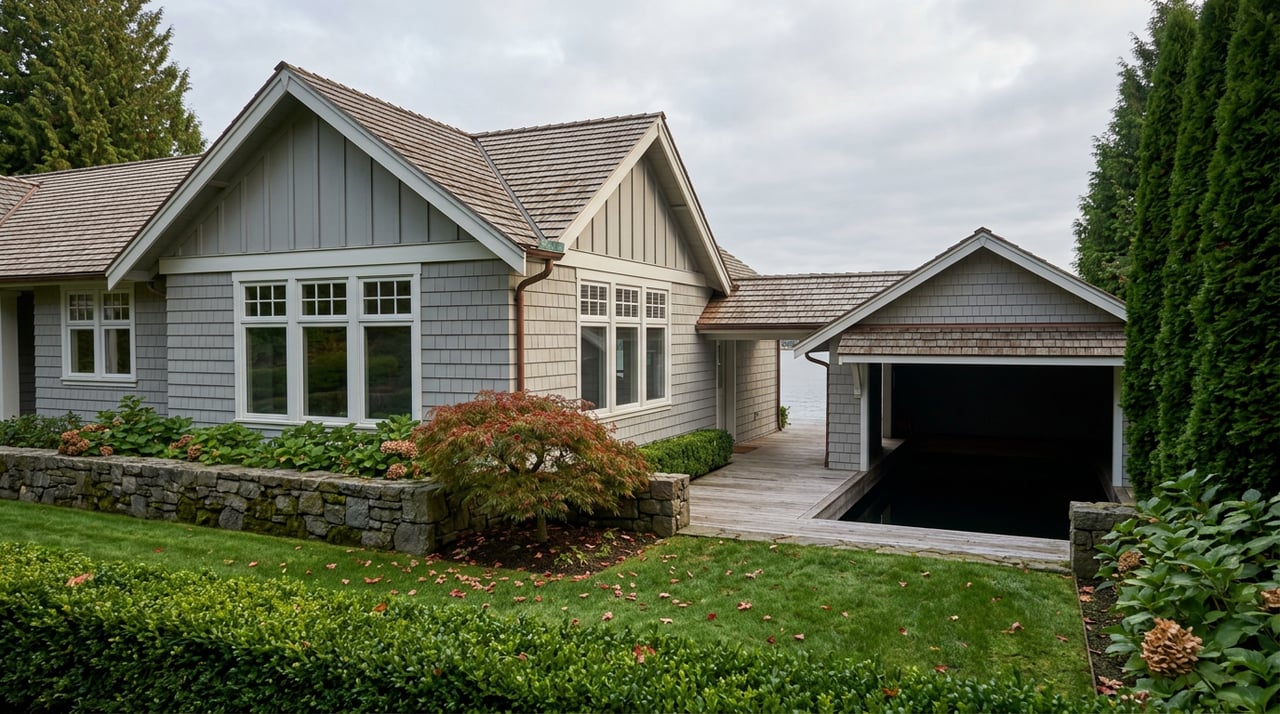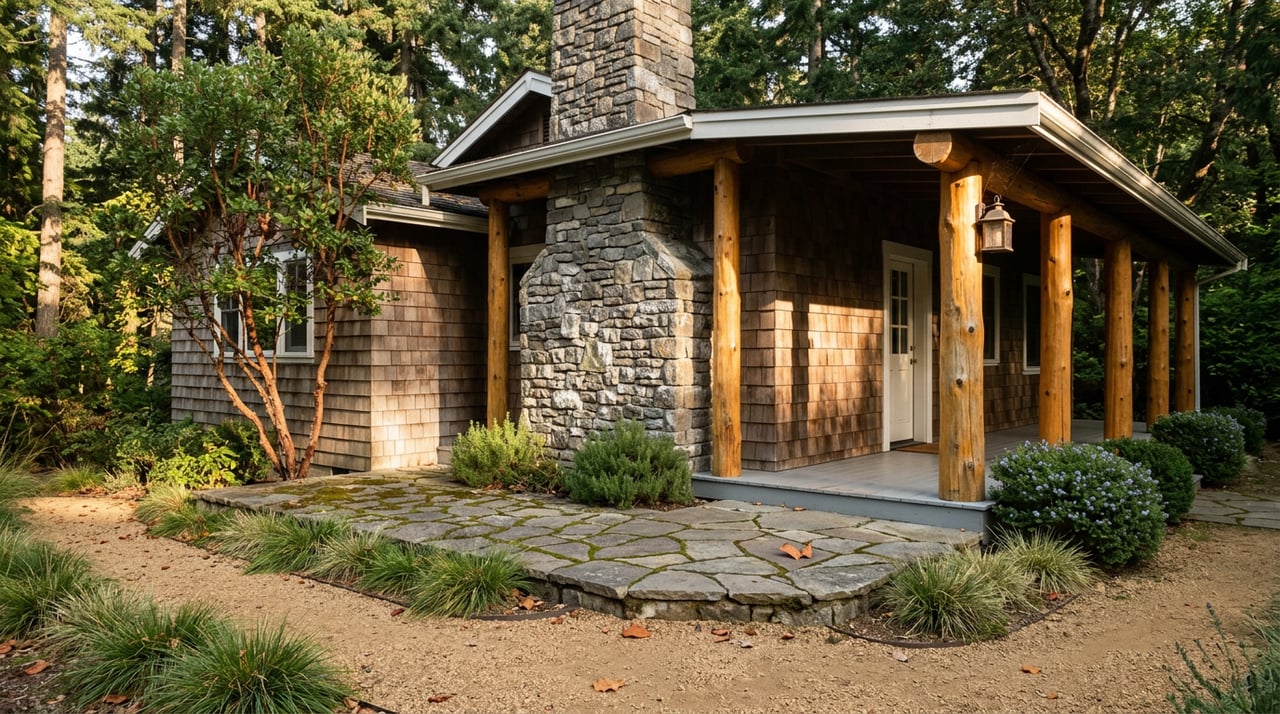
Before a buyer can build on most waterfront lots in San Juan County, they need what's called a Regulatory Pre-Application, or RPA. It costs somewhere between $2,300 and $3,000, takes weeks to process, and isn't even binding. What it does is map out the practical limits of a parcel: where the county's shoreline setback creates a roughly 35-foot no-touch zone from the water, where a driveway and septic system can legally sit, which trees can come down. Buyers who skip this step and assume a listing photo tells them what they can build often find out otherwise, and by then they've already made an offer.
That kind of friction is easy to miss if you're comparing San Juan Island and Orcas Island purely on price. And the price comparison itself has a problem that most buyers never catch: depending on which time window you look at, these two islands are telling you two contradictory stories about their own markets right now.
The Median Is Doing Two Different Jobs at Once
Over a three-month window ending in May 2026, San Juan Island's median sale price sat near $1.2 million, up 53.2% from the same period a year earlier. Homes were selling in an average of 22 days, down from 33 days the year before. Orcas Island posted a similar $1.2 million median over the same window, up 28.3% year over year, though homes there took longer to sell, averaging 35 days versus 27 days a year earlier.
Zoom out to a full 12-month trailing window, the one local market reporting actually prefers for a county this size, and the picture flattens. In a report covering the 12 months through mid-2026, San Juan Island's trailing median sat at $795,000, essentially unchanged from the same 12-month window a year prior. At year-end 2025, that same style of 12-month median had been $775,000, down 8% from 2024's $842,000. County-wide, the mid-2026 trailing 12-month median was reported at $930,000, up 10% year over year, a number pulled higher by Orcas.
Local reporting explains why the long window is used at all: the market is small enough that a handful of high-dollar closings can swing a monthly or quarterly median in ways that don't reflect where prices are actually headed. A three-month snapshot with 20 sales can look like a boom or a correction depending on which properties happened to close. A 12-month window smooths that out, but it also means the number you're reading today reflects deals that closed as far back as last summer.
Neither number is wrong. They're measuring different things. The mistake is treating either one as the whole answer.
San Juan Island and Orcas Island, Side by Side
The clearest read on where momentum actually sits in 2026 isn't the median at all. It's dollar volume, because dollar volume captures both how many homes sold and what they sold for, without smoothing anything out.
| Metric (first half of 2026) | San Juan Island | Orcas Island |
|---|---|---|
| Dollar volume | $55.26 million | $86.72 million |
| Closed transactions | 53 | 50 |
| Dollar volume vs. same period 2025 | down 3% | up 67% |
| Transaction count vs. same period 2025 | down 27% | about flat |
| Share of county-wide dollar volume | — | more than half |
Orcas Island, with a smaller population base and no incorporated town of its own, produced more real estate dollar volume in the first half of 2026 than San Juan Island, the county seat and historically the more liquid market of the two. That's a reversal worth sitting with. It didn't happen because more people bought on Orcas. Transaction counts on the two islands were nearly identical. It happened because the deals closing on Orcas were, on average, considerably larger.
Why Orcas Pulled Ahead
The county-wide average sale price across all property types climbed from $849,000 in the first half of 2025 to $1,300,500 in the same period of 2026. San Juan Island's own average sale price moved from $776,800 to $1,042,700 over the same stretch. Averages like this aren't appreciation measures. They shift when the mix of what's selling shifts, and right now the mix is tilting toward bigger transactions.
That tilt shows up clearly in the higher price tiers. Across 2025, San Juan Island closed 49 sales above $1 million, up from 40 in 2024. County-wide, sales above $1 million rose from 96 to 114. Fifteen of those county sales closed above $3 million, a tier that had been essentially absent from the market during the second half of 2022 and all of 2023 and 2024. The high end came back in 2025, and the first half of 2026 suggests it kept coming, disproportionately on Orcas.
Meanwhile, the county-wide market as a whole is not uniformly hot. May 2026 was a genuinely slow month, with county-wide sales down 44% and San Juan Island sales down 36% compared to May 2025, part of a broader statewide slowdown that month. Vacant land tells a similar buyer's-market story: San Juan Island land sales over the trailing 12 months averaged 8.25% off list price, sat on the market an average of 136 days, and totaled just 13 closed transactions at a median price of $250,000. A market with that little data behind it can swing on one or two sales, which is exactly why treating any single monthly number as gospel is a mistake in either direction.
What This Actually Means for a Buyer Choosing Between the Two
If you're deciding between San Juan Island and Orcas Island as a second home or resort purchase, the median price alone won't tell you which market has more energy behind it right now. The transaction data does. Orcas is currently absorbing more capital, concentrated in fewer but larger deals, which typically means less competition per listing at the very top of the market and more patience required at the entry level, where days on market have stretched. San Juan Island, with faster average sale times over the recent three-month window but a 27% drop in transaction count, looks like a market where fewer buyers are moving but the ones who are moving are moving fast on the right property.
Neither pattern is permanent. Both islands are small enough that a single well-marketed estate closing can shift next quarter's numbers meaningfully. That's the whole point: in a market this size, the number is only useful once you know what window it's measuring and what's driving it.
The Paperwork That Comes With Island and Waterfront Property
A handful of local requirements catch buyers off guard, especially on waterfront parcels:
- The RPA process for waterfront lots costs roughly $2,300 to $3,000, is non-binding, and is generally worth completing before closing on any undeveloped or underdeveloped waterfront parcel, since it maps the shoreline setback, buildable area, and utility placement under current rules.
- Septic inspections are required before a sale. A county-approved inspector checks the system, and buyers should budget around $350 for the inspection itself plus $1,000 to $1,200 if a pump-out is needed. The system's rated capacity has to match the home's bedroom count, and a bedroom is defined by the county as a room with a closet, a legal-size window, and a closing door. A home with three bedrooms but a two-bedroom septic system has to be marketed accordingly.
- Well draw-down tests on waterfront properties can only be performed between July and October, and are required whenever the wellhead sits within 1,000 feet of the shoreline. A closing that falls outside that window can face real delays if this test hasn't already been done.
- Owner-built homes constructed after 1988 require a county Life Safety inspection within 30 days of a sale or rental, at a cost of about $150, with any deficiencies corrected before the final sign-off. Details on the county's on-site sewage program are public record and worth a buyer's own review.
- New construction costs vary widely, from roughly $175 per square foot for modest builds up to $1,000 per square foot at the high end, a spread worth factoring in before comparing an existing listing against the cost of building new.
Typical transaction timelines run about 45 days with financing and 30 days for cash, though any of the items above can extend that window.
A Few Questions Worth Asking Before You Choose
Is Orcas Island more expensive than San Juan Island right now? Over the three months ending in May 2026 both islands carried a similar median near $1.2 million. The real difference isn't price, it's that Orcas is producing more total dollar volume from fewer, larger transactions, while San Juan Island's overall transaction count has pulled back.
Should I trust the median price listed for either island? Treat it as one data point, not the whole picture. A 12-month median smooths out the swings that come from a small number of sales, but it also lags behind what's actually happening this quarter. Dollar volume and transaction counts over the same period tell you more about current momentum.
Does the waterfront permitting process apply to every property? The RPA and shoreline setback rules apply specifically to waterfront and wetland-adjacent parcels. In-town and interior lots typically face a simpler path, though septic and, where applicable, Life Safety inspection requirements still apply county-wide.
Numbers this size move fast, and the story they tell depends entirely on which window you're looking through. If you're weighing San Juan Island against Orcas Island for a second home, the right read on 2026 requires more than a portal's headline median. Lisa Turnure works across both islands and the broader San Juan Islands market and can walk through what the current data actually means for a specific property or timeline. Reach out to receive exclusive listings before they reach the wider market.